Michael Branion-Calles
Postdoctoral Research Fellow,
University of British Columbia
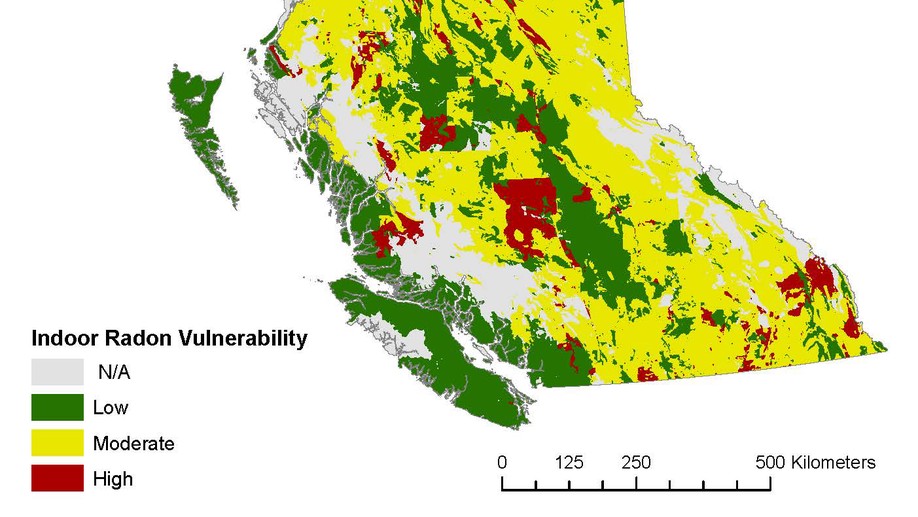
I am a health geographer interested in answering applied questions at the intersection of transportation, safety and health. I received my Ph.D in 2020 from the faculty of Health Sciences at Simon Fraser University in the Cities, Health and Active Transportation Research (CHATR) Lab. In my Ph.D I used a variety of novel datasets (volunteered geographic information, as well as longitudinal and cross-sectional survey data) to evaluate the objective and perceived safety of bicycling. I completed my M.Sc in the department of Geography at the University of Victoria in 2015 in the Spatial Pattern Analysis and Research (SPAR) Lab where I used machine learning and GIScience approaches to map indoor radon in the province of BC.
I am currently a postdoctoral research fellow at the University of British Columbia and at Ryerson University. In my research I am measuring injury and mortality risks among Canadian active transport users (bicyclists and pedestrians) using large population-based linked datasets.
Education
-
PhD in Health Sciences, 2020
Simon Fraser University
-
MSc in Geography, 2015
University of Victoria
-
BSc in Geography, 2013
University of Victoria
Interests
- Transportation
- Road Safety
- Environmental Health
- Spatial Science